This statistics fully Support and Resistance, Trend line, Candle sticks patterns, Entry & Exit, Stoploss, Targets. These and all changing your trading journey.
Unlocking the Potential Strategy of Bank Nifty for July 22
Welcome to journeyoftrading. I’m using only Candlestick Patterns, support and resistance, trend lines, and pivot points. These indicators are enough for a trading strategy. This strategy includes proper entry and exit and stoploss with trading psychology.
For Frequent updates and more informations follow my page.
Live chart analysis video uploaded for below youtube link
https://youtube.com/@journeyoftrading2024?si=-7rHkIf3g1U8ZWS7
Now we are going to do chart analysis for the Bank Nifty on July 22, 2024. The Bank Nifty chart having strong support Zones for 52,200. This point 12th July, 15th July, 18th July & 19th July react to support zone. It’s a support zone.
If market will take a support from 52,200 the market will go to up. This will go to yesterday market 50% range. If the over crossing the yesterday 50% zone the marlet again go to 52,600.
In the event that market opening is a gap down, the 52,200 will be the resistance zone. It will fall to 51,900. Once the market breaks the 52,200 strike price, nearly 300 points move to the down side.
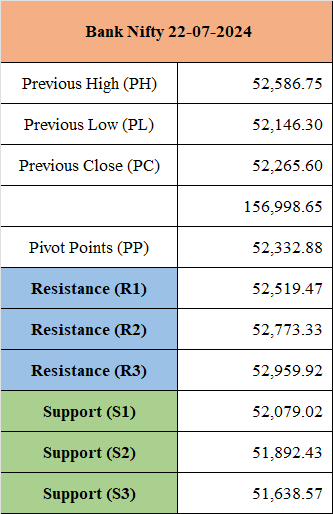
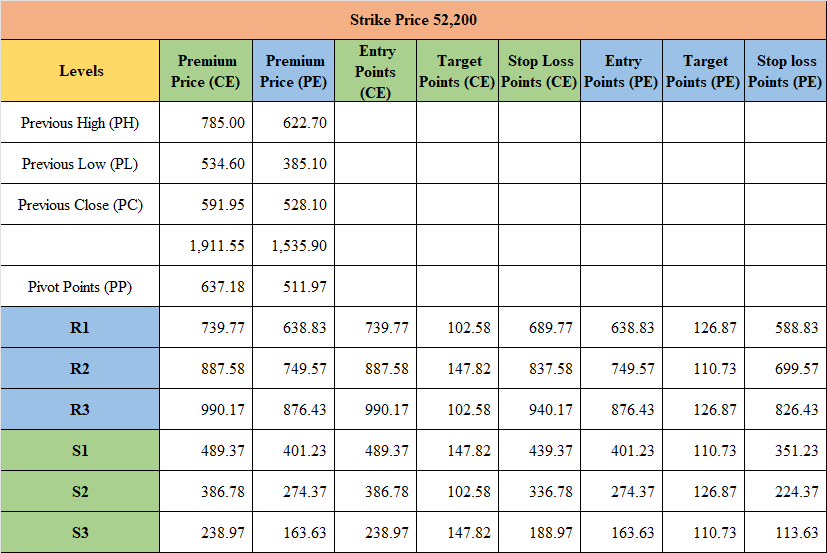
The Pivot points, Support and Resistance, Entry & Exits, Stoploss, Targets updated the below table.

The 52,200 Strike price Pivot points,Support and Resistance, Entry & Exit, Targets, Stoploss, Preminum price updated for below.

The 52,400 Strike price Pivot points,Support and Resistance, Entry & Exit, Targets, Stoploss, Preminum price updated for below.

The 52,600 Strike price Pivot points,Support and Resistance, Entry & Exit, Targets, Stoploss, Preminum price updated for below.

Leave a comment
Your email address will not be published. Required fields are marked *


