Learn how to effectively analyse Adani Power's stock using key technical indicators like pivot points, support, and resistance levels. Understand price targets to make informed trading decisions.
1. Price Information:
- High: 512.05 — The highest price reached by the stock during the given time period.
- Low: 490.65 — The lowest price reached by the stock during the given time period.
- Close: 495.95 — The closing price of the stock at the end of the trading session.
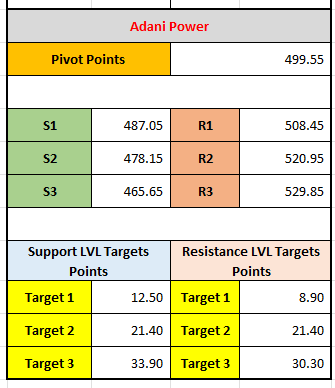
2. Pivot Points:
The pivot point is a technical analysis indicator used to determine potential support and resistance levels. It's calculated using the high, low, and close prices of the previous period.
- Pivot Point (499.55): The base level for determining potential support and resistance levels. It often serves as an indicator of the overall market trend.
- If the price is above the pivot point, it’s typically considered a bullish (upward) market sentiment.
- If the price is below the pivot point, it’s typically considered a bearish (downward) market sentiment.
3. Support Levels (S1, S2, S3):
These are levels where the price is expected to find support, meaning the price may "bounce" or reverse direction if it approaches these points.
- S1 (487.05): The first level of support, suggesting the price may find a cushion at this level.
- S2 (478.15): The second support level, deeper down.
- S3 (465.65): The third support level, even lower.
4. Resistance Levels (R1, R2, R3):
Resistance levels indicate where the price may face selling pressure and reverse direction.
- R1 (508.45): The first resistance level, where the price may struggle to rise above.
- R2 (520.95): The second resistance level, higher up.
- R3 (529.85): The third resistance level, even higher.
5. Target Levels for Support and Resistance:
These targets suggest possible movements in the price based on historical price action and expected price behavior.
Support LVL Targets Points:
- Target 1 (12.50): The first target for support indicates the price could move down by 12.50 points from the current level.
- Target 2 (21.40): The second support target.
- Target 3 (33.90): The third support target.
Resistance LVL Targets Points:
- Target 1 (8.90): The first target for resistance suggests the price may move up by 8.90 points from the current level.
- Target 2 (21.40): The second resistance target.
- Target 3 (30.30): The third resistance target.
Summary:
- The pivot point (499.55) is the main level to watch. If the stock is above this point, it's considered bullish, and if it's below, bearish.
- The support levels (S1, S2, S3) indicate where the price might drop to, while resistance levels (R1, R2, R3) show where the price might face resistance as it tries to move higher.
- The target points for both support and resistance give further expectations on potential price movements.
By using this information, traders can make informed decisions about where to place their buy or sell orders based on the expected market movement.
Leave a comment
Your email address will not be published. Required fields are marked *