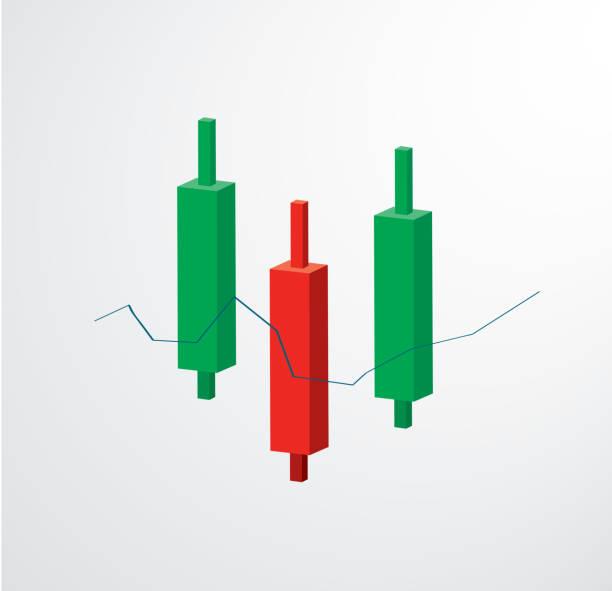
Candlesticks Patterns for Bullish and Bearish. This statistics fully support and resistance, Trend line, Candle sticks patterns. These and all changing your trading journey.
What is mean by Candlesticks?
The Price movements in financial markets displaying the open, close, high and low price within a specified time frame.
Its reflect the market strength of buyers and sellers.
Body
The main rectangular part of the candlestick that represents the price range between the opening and closing prices. A filled (green) body indicates a price increase, while a hollow (red) body indicates a price decrease.
Wicks
The lines extending above and below the body of the candlestick. The upper wick shows the highest price reached, and the lower wick shows the lowest price reached during the time period.

Two types of Candles
1. Bullish Candle
2. Bearish Candle
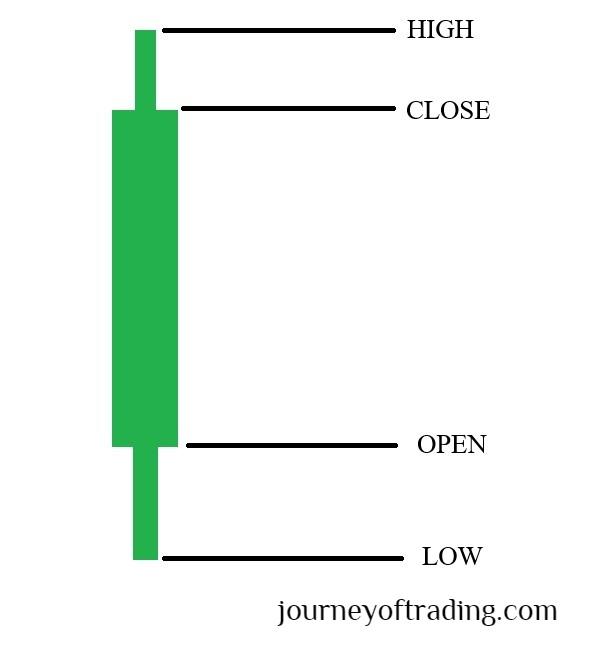
Bullish Candle
The Bullish candle Close price is more than the opening price. It’s a full body colour is green
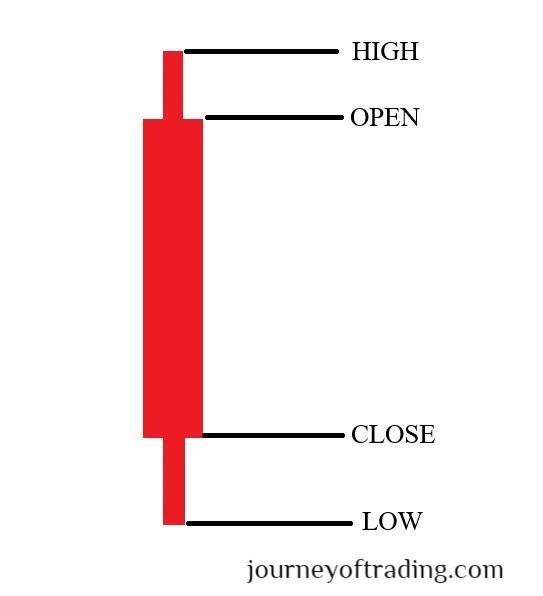
Bearish Candle
The Bearish Candle Close price is less than the opening price. it’s a full body colour is Red.
Support Level Candle sticks
1. Hammer
2. Inverted Hammer
3. Bullish Engulfing
4. Morning Star
5. Spinning Top
6. Doji
1.Hammer
A bullish reversal pattern characterized by a small body near the high of the session, with a long lower shadow that is at least twice the length of the body. It suggests that sellers drove prices lower during the session, but buyers ultimately pushed the price back up, signalling potential price reversal from a downtrend to an uptrend.

2.Inverted Hammer
An inverted hammer is a bullish reversal candlestick pattern characterized by a small body located near the low of the session, with a long upper shadow that is at least twice the length of the body. It suggests that sellers drove prices lower during the session, but buyers stepped in to push the price back up, signalling potential price reversal from a downtrend to an uptrend.
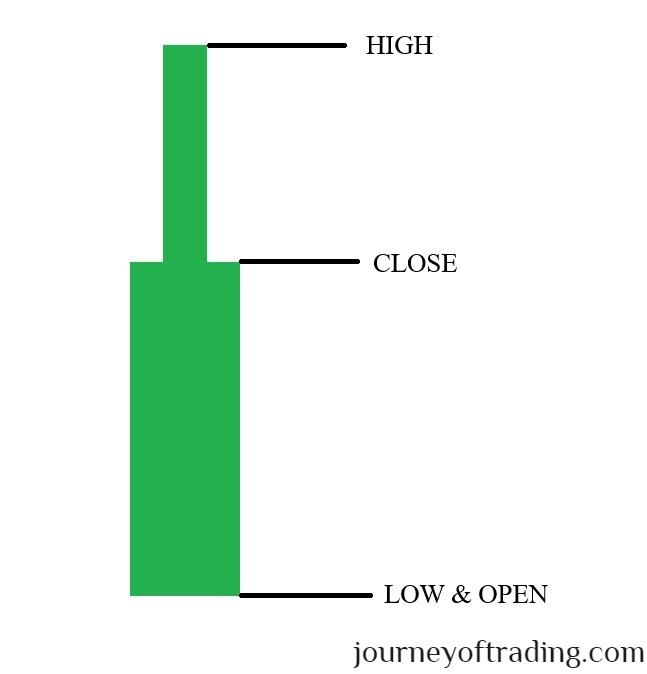
3.Bullish Engulfing
A "bullish engulfing" pattern in technical analysis is a candlestick formation that appears when an asset's price has been declining, indicating a possible reversal toward upward movement.
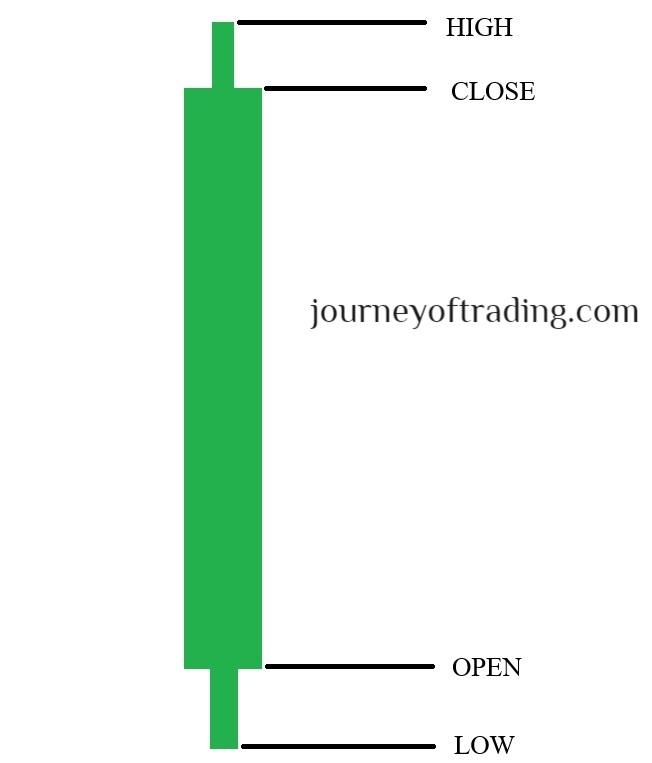
4.Morning Star
The "morning star" pattern is a bullish candlestick formation with three candles: a large bearish candle, a small-bodied candle showing indecision, and a large bullish candle closing above the first candle's midpoint, indicating a possible trend reversal from downtrend to uptrend.
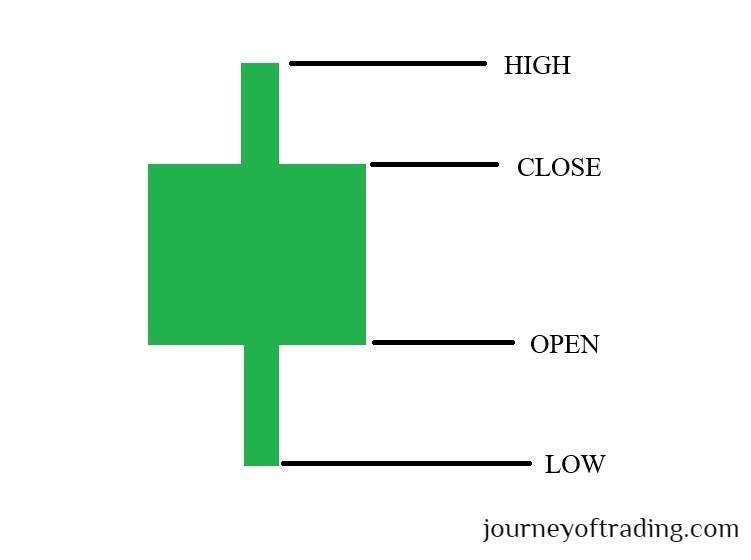
5.Spinning Top
A "spinning top" is a candlestick pattern with a small body and long upper and lower wicks, signaling market indecision after a notable price change and possibly suggesting a reversal or consolidation ahead.
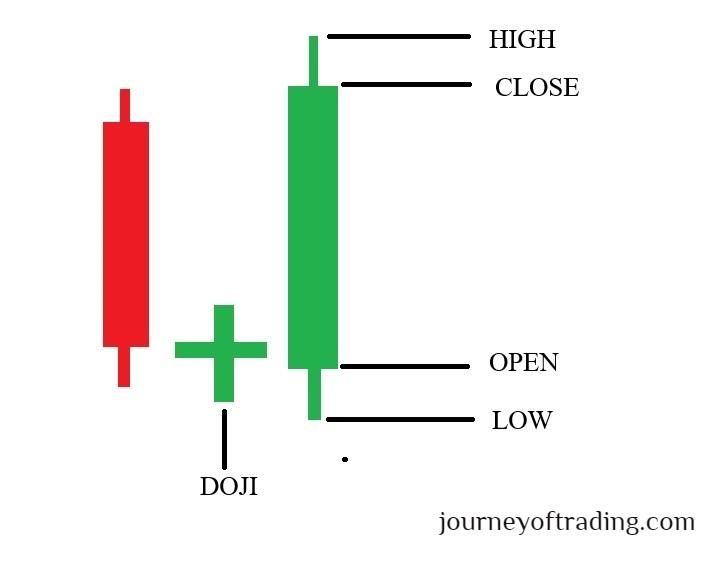
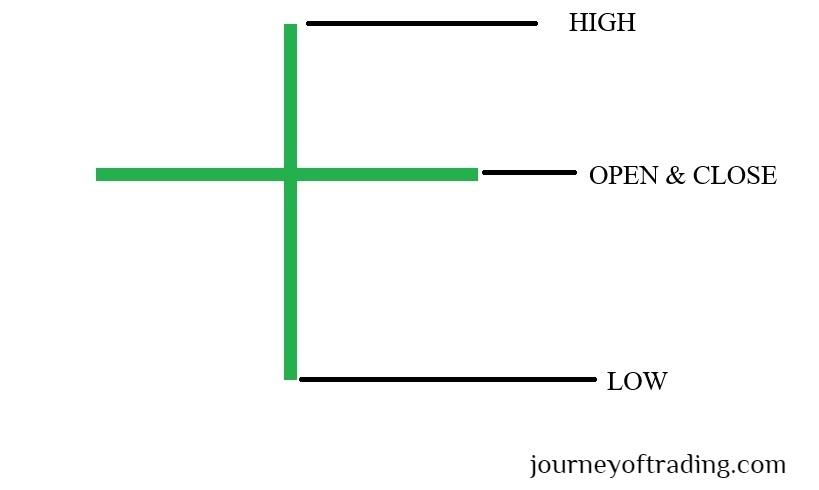
6.Doji
A "doji" is a candlestick pattern with a small body, where the open and close prices are almost the same, indicating market indecision and potentially signaling a reversal, particularly after a long trend.
Resistance Level Candle sticks
1. Hanging Man
2. Shooting Staar
3. Bearish Engulfing
4. Evening Star
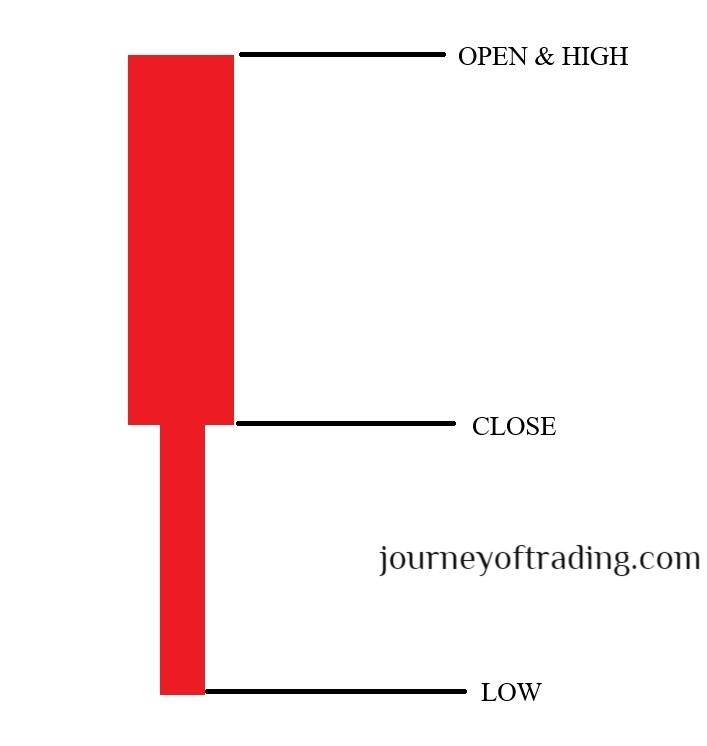
1.Hanging Man
A "hanging man" is a bearish candlestick pattern seen at the end of an uptrend, characterized by a small body near the top of the price range and a long lower shadow, signaling a potential reversal to the downside as sellers gain strength over buyers.
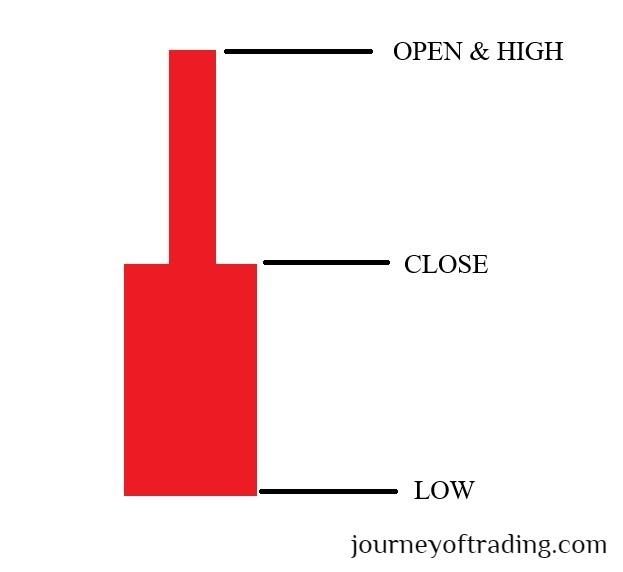
2.Shooting Star
A "shooting star" is a bearish candlestick pattern seen at the end of an uptrend, featuring a small body near the bottom of the price range and a long upper shadow, signaling potential seller dominance and a likely downward trend reversal.
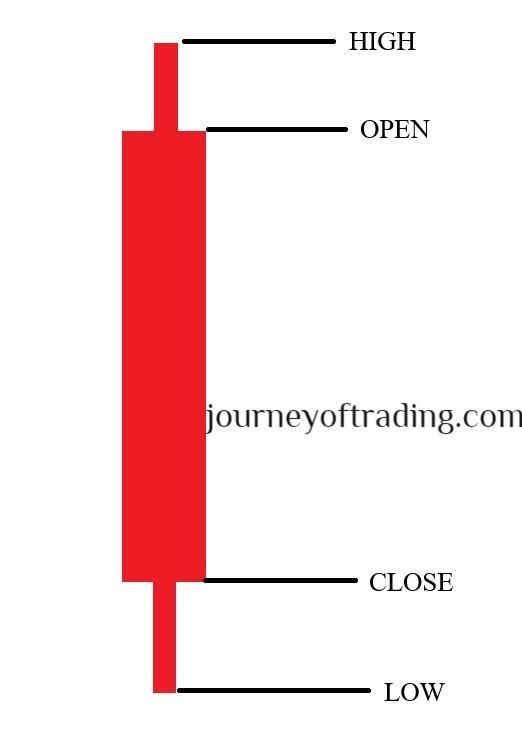
3.Bearish Engulfing
A "bearish engulfing" is a bearish reversal candlestick pattern that typically occurs at the end of an uptrend. It consists of two candles: the first is a small bullish candle, followed by a larger bearish candle that completely engulfs the body of the first candle. This pattern suggests a shift in sentiment from bullish to bearish, potentially signaling a reversal to the downside.
4.Evening Star
The "morning star" pattern is a bearish candlestick formation with three candles: a large bullish candle, a small-bodied candle showing indecision, and a large bearish candle closing above the first candle's midpoint, indicating a possible trend reversal from uptrend to downtrend.

Leave a comment
Your email address will not be published. Required fields are marked *
