Future & Options - Profitable Trend Analysis. This statistics fully support and resistance, Trend line, Candle sticks patterns. These and all changing your trading journey.
Profitable Trend Analysis
Welcome to journeyoftrading. I’m using only Candlestick patterns, support and resistance, trend lines, and pivot points. These indicators are enough for a trading strategy. This strategy includes proper entry and exit and stoploss with trading psychology.
For Frequent updates and more informations follow my page.
Live chart analysis video uploaded for below youtube link
https://youtube.com/@journeyoftrading2024?si=-7rHkIf3g1U8ZWS7
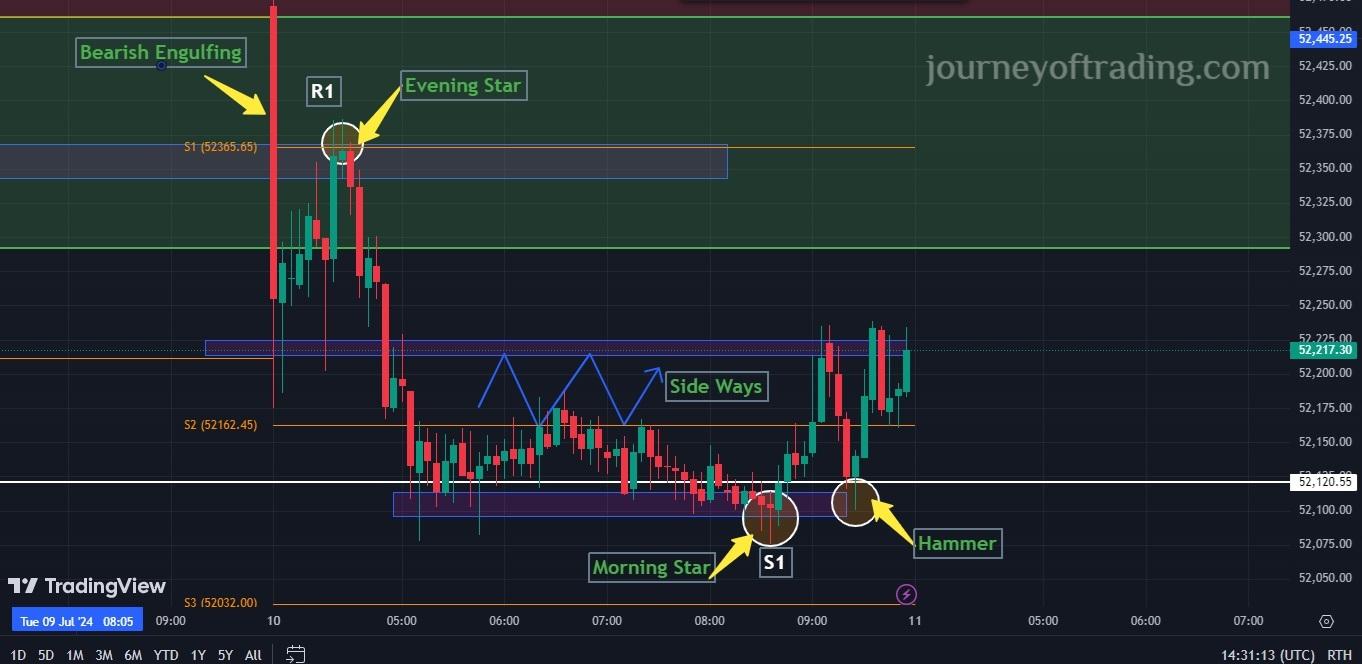
Now we are going to do chart analysis for the Bank Nifty on July 10, 2024. First I will discuss Market over view. Today the market is open on yesterday's close points. Yesterday, the sideways zone brooked. The morning starts with one longer bearish candle. This candle is identified for market go-down.
The second candle takes a support from the first candle's low point. This is called first candle support. Morning first candle mentioned for down trend. It's not a downtrend confirmation. The second candle is one type of buying confirmation due to the hammer candle.
Hammer candle is important for buying zone. Some traders are taking entries from here. It’s a fake candle. Because of the above, one strong resistance zone is there. This resistance zone will be explained below briefly.
In between trading hours today, a sideways zone also formed. Both buyers and sellers are dominating the market. Buyers push the market above, and sellers pull the market below. In between zones, there is slightly average movement. Today in the in the market, I got the three entry points for the put option and the call option. Entry points are listed below, and I will explain them one by one.
1.Evening Star
What is an Evening star? When the market is going up, some rejection will happen. This resistance zone candle is doji + shooting star/hanging man = evening star. The evening star picture is attached below.

Today's market opening candle is a is a longer Bearish candle. It’s a selling signal. But buyers also dominate the first half of the hour. It's not a downtrend confirmation. Next, buy a confirmation candle made of hammer. After that morning, a star also formed. These candles are not confirmation candles. Because of the strong resistance to it,.
Who and all identified I don’t know. But we have one resistance zone. Same resistance 05/07/2024, 08/07/2024, and 09/07/2024 react on the support zone. That support zone today reacts to resistance.
Now I take the entry from here and put the option entry. The next market broke the first candle support. Now it is confirmed for a downward trend direction.
Entry and Exit
Strike Price : 52,400 PE
Premium Buy Price : 167.90
Premium Sell Price : 366.80
Stop Loss : 148.10
Risk Points : 19.8
Reward Points : 198.90
First Entry Psychology
From morning onwards, the market creates all the candles for buying and selling on both sides. But these are all not confirmations. It’s a fake candle. Hammer candle, Moring star candle, these and all buying confirmation. Don’t react to all the candles. As mentioned above, both candles are playing with your psychology today.
In between market hours,. Sideways also give some fake candles. This sideways is given for some buying candles like hammers, inverted hammers, bullish candles, etc. Now we discuss the next candle morning star.
2.Morning Star
It’s important for the support zone. Toady also plays an important role in the morning star candle. This side-ways zone takes a support of sixth time (S6). It's purely a buying confirmation. Today, no trend line was found.
Next, the market goes up to today's first candle support. This support right now reacts to the resistance zone. Again market falling take a support from same side way zone. The below Morning star entry analysis is attached.
Entry & Exit
Strike Price : 52,1100 CE
Premium Buy Price : 42.85
Premium Sell Price : 130.55
Stop Loss : 30.15
Risk Points : 12.7
Reward Points : 87.70
Second Point Psychology
The second entry was found in the sideways zone. Here, shooting star and evening star found, it’s a fake candle. It's not a confirmation of a downtrend. Because of the sideways zone, it is not broken.

3.Hammer
It’s support taken from the same side-way zone. It starts with a Hammer candle. Again, the market reached the first candle support zone. The resistance zone that breaks the market is going to go up and reach the first candle resistance zone. Unfortunately, the market its not going to pick up. Again, the market reacts to the selling candle. Second of the market fully sideways.
This candle formed for the market closing before half an hour. Now buyers and sellers dominate the market. Same as that yesterday.
Third-Entry Psychology
The first candle support zone rejected the candles. Now it's formed on a Spinning top. Continuously, the market going down. Here, some traders are taking entry from the put option because sellers dominate. It's a sideways zone; don’t take entry from sideways. Here, the bearish candle is a fake candle. Chart analysis is attached below.

Leave a comment
Your email address will not be published. Required fields are marked *


