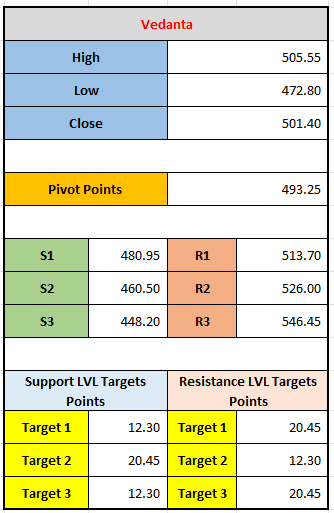
The data is technical analysis of Vedanta's stock price. It includes pivot points, support and resistance levels, and price targets, all of which are key concepts in technical analysis used to help predict potential future price movements.
Breakdown:
- Price Levels:
- High: 505.55
- Low: 472.80
- Close: 501.40
- These values represent the highest, lowest, and closing prices of the stock during the given period.
Pivot Point (PP): 493.25
- This is the primary level of support or resistance and is calculated based on the high, low, and close prices. It acts as a key reference point for potential price movement. If the price is above the pivot point, the sentiment is generally bullish, and if it's below, the sentiment is bearish.
Support Levels (S1, S2, S3):
- S1 (480.95): The first support level, where the price may find support and could potentially bounce higher if it drops to this level.
- S2 (460.50): The second level of support, lower than S1. If the price breaks through S1, it might find support at this level.
- S3 (448.20): The third level of support, lower than S2. It represents a deeper price level that could act as support in extreme cases.
Resistance Levels (R1, R2, R3):
- R1 (513.70): The first resistance level, where the price might face selling pressure and struggle to break through if it moves upwards.
- R2 (526.00): The second resistance level, higher than R1, indicating a stronger barrier if the price moves higher.
- R3 (546.45): The third resistance level, further above R2. If the price breaks R2, this level becomes a major point where the price might struggle to move higher.
Support and Resistance Level Targets:
- Support Level Targets: These indicate how much the stock price might fall before finding support.
- Target 1 (12.30): This suggests that if the stock breaks the pivot or first support level, it might move down by around 12.30 points to hit a lower support level.
- Target 2 (20.45): If the stock continues to fall, it might target a further decline of 20.45 points.
- Target 3 (12.30): This target repeats the first target, suggesting another possible drop of 12.30 points if the price continues down.
- Resistance Level Targets: These are points where the stock price could face resistance.
- Target 1 (20.45): This suggests that if the stock rises, it could increase by 20.45 points before facing resistance at R1.
- Target 2 (12.30): After reaching the first resistance level, the stock could continue rising by 12.30 points, targeting R2.
- Target 3 (20.45): This suggests that after R2, the stock might reach a resistance level higher by 20.45 points, aiming for R3.
Interpretation:
- Pivot Point: The current price is 501.40, which is slightly above the pivot point of 493.25. This suggests that the sentiment is somewhat bullish, and the price might move towards the resistance levels.
- Support Levels: If the price declines, it might find support first at S1 (480.95), then S2 (460.50), and finally S3 (448.20). The stock may face downward pressure, but these levels could act as price floors, potentially causing a bounce.
- Resistance Levels: On the upside, if the price continues to rise, it will likely encounter resistance at R1 (513.70), R2 (526.00), and R3 (546.45). If the price breaks through these levels, it could signal further upward movement.
- Target Levels: The target levels provide an estimate of how much the stock might move in either direction. For the support side, the stock could potentially drop 12.30 or 20.45 points. On the resistance side, the stock could rise by similar amounts, indicating possible price movements based on market sentiment and trading volume.
By using this information, traders can make informed decisions about where to place their buy or sell orders based on the expected market movement.
Leave a comment
Your email address will not be published. Required fields are marked *


