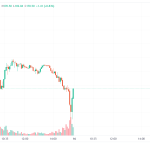
Integrating these elements price action, candlestick patterns, trend lines and channels, and trends creates a well-rounded approach to trading
Price Action Trading - Technical Analysis and Trend Analysis
Technical Analysis of Price Charts Bar by Bar for the Serious Trader" is a comprehensive guide to understanding and trading based on price action. Let’s break down some of the core concepts and tools mentioned:
1. Basics of Price Action and Candles
Price Action: This refers to the analysis of price movements in a market, without relying on technical indicators. The idea is to observe and interpret the raw price data (open, high, low, and close) to make trading decisions.
Candlestick Patterns: Candlestick charts are a popular way to represent price action. Each candlestick provides a visual summary of price movements for a specific period, and patterns formed by these candles can reveal market sentiment and potential price movements.
- Trend Bar: A trend bar has a strong body with little or no wick. It signifies a strong price movement in one direction (bullish or bearish). A long green (or white) bar indicates strong buying pressure, while a long red (or black) bar indicates strong selling pressure.
- Doji: A doji is a candle with a very small body and long wicks (or shadows) on either side. It signifies indecision in the market, where the opening and closing prices are almost the same. A doji suggests that neither bulls nor bears are in control, which can signal a potential reversal or continuation of the current trend.
2. Trend Lines and Trend Channel Lines
Trend Lines: Trend lines are diagonal lines drawn on a price chart to connect significant highs or lows. They help to identify the direction of the trend and can act as support or resistance levels.
- Upward Trend Line: Drawn by connecting the higher lows in an uptrend. This line acts as a support level, indicating that buyers are consistently pushing the price higher.
- Downward Trend Line: Drawn by connecting the lower highs in a downtrend. This line acts as a resistance level, showing that sellers are consistently pushing the price lower.
Trend Channel Lines: Trend channels consist of two parallel lines that enclose the price movement. They are created by drawing two trend lines—one connecting the highs and another connecting the lows.
- Upper Channel Line: Connects the higher highs in an uptrend.
- Lower Channel Line: Connects the higher lows in an uptrend.
- Channels in Downtrends: The upper line connects the lower highs, while the lower line connects the lower lows.
Trend channels help traders to identify the range within which the price is moving. Price often bounces between the channel lines, providing potential trading opportunities at the channel's boundaries.
3. Trends
Trends represent the general direction of price movement over a period. Identifying and understanding trends are crucial for making informed trading decisions.
- Uptrend: An uptrend is characterized by a series of higher highs and higher lows. This indicates that buying pressure is stronger than selling pressure, and the market is generally moving upward.
- Downtrend: A downtrend is marked by a series of lower highs and lower lows. This indicates that selling pressure is stronger than buying pressure, and the market is generally moving downward.
- Sideways Trend (Trading Range): When the market is moving within a horizontal range without clear upward or downward direction. The price fluctuates between established support and resistance levels. This can often be seen in consolidating markets or periods of indecision.
Profitability of Trends: Trends are typically the most profitable market conditions because they offer more significant movement in price, providing more opportunities for substantial gains. Traders often look for strategies to enter and exit trades in alignment with these trends to maximize their profits.
Conclusion
- Price Action: Focuses on the raw price data and patterns formed by candlesticks to gauge market sentiment and potential price movements.
- Candlestick Patterns: Provide insights into market psychology and potential reversals or continuations.
- Trend Lines and Channels: Essential tools for identifying the direction and range of trends, aiding in the visualization of support and resistance levels.
- Trends: The general direction of the market, crucial for trading decisions. Understanding trends helps traders to align their strategies with market movements, enhancing profitability.
Leave a comment
Your email address will not be published. Required fields are marked *


