Analyze key support, resistance, and pivot levels for NHPC stock, along with price targets and potential market movements.
The stock analysis for NHPC, including its high, low, and closing prices, as well as key levels like Pivot Points, support, and resistance. Here’s a breakdown of the details:
Stock Data for NHPC:
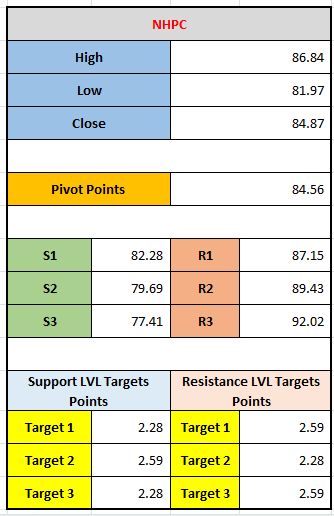
- High: 86.84
- Low: 81.97
- Close: 84.87
Pivot Points:
- Pivot Point (PP): 84.56 (This is the central point used to gauge the market's direction, calculated as an average of the high, low, and close prices).
Support and Resistance Levels:
- Support (S) levels:
- S1: 82.28
- S2: 79.69
- S3: 77.41
- Resistance (R) levels:
- R1: 87.15
- R2: 89.43
- R3: 92.02
Target Points for Support and Resistance:
- Support Levels Target Points:
- Target 1: 2.28 points (difference between current price and S1 level)
- Target 2: 2.59 points (difference between current price and S2 level)
- Target 3: 2.28 points (difference between current price and S3 level)
- Resistance Levels Target Points:
- Target 1: 2.59 points (difference between current price and R1 level)
- Target 2: 2.28 points (difference between current price and R2 level)
- Target 3: 2.59 points (difference between current price and R3 level)
Interpretation:
- The Pivot Point (84.56) acts as a key level. If the price is above this, the market might be in an uptrend, and if it's below, the market could be in a downtrend.
- The Support Levels (S1, S2, S3) indicate areas where the price might find support and potentially reverse if it moves downward.
- The Resistance Levels (R1, R2, R3) show areas where the price might face resistance if it moves upward.
- The Target Points represent the expected movement (upward or downward) from the current price based on the pivot points, support, and resistance levels. For example, the price might aim to increase by 2.59 points to reach R1 or decrease by 2.28 points to hit S1.
Potential Trading Strategy:
- Bullish Case: If NHPC's price breaks above the pivot point (84.56), it may attempt to reach R1 (87.15) or R2 (89.43).
- Bearish Case: If the price falls below the pivot, it could target the support levels at S1 (82.28) or S2 (79.69).
- Traders can monitor price movement relative to these levels to make informed decisions on buying or selling.
By using this information, traders can make informed decisions about where to place their buy or sell orders based on the expected market movement.
Leave a comment
Your email address will not be published. Required fields are marked *


