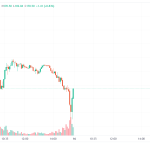
NTPC Green Energy Stock Technical Overview (09-12-2024): Analyze current market trends, including key support and resistance levels, pivot points, and price targets for the upcoming trading period.
The NTPC Green Energy on a specific trading day, along with calculated pivot points, support levels, resistance levels, and target points.
Breakdown of the Information:
- High Price: ₹146.20
- Low Price: ₹139.67
- Closing Price: ₹143.99
- Pivot Point: ₹143.29
- This is the key level used by traders to determine the general market trend. If the price is above the pivot point, the market is considered bullish, and if it's below, it is considered bearish.
Support and Resistance Levels:
- S1 (Support Level 1): ₹140.37
- S2 (Support Level 2): ₹136.76
- S3 (Support Level 3): ₹133.84
These are the levels at which the stock might find support if the price is falling. The price may bounce back from these levels.
- R1 (Resistance Level 1): ₹146.90
- R2 (Resistance Level 2): ₹149.82
- R3 (Resistance Level 3): ₹153.43
These are the levels at which the stock might face resistance if the price is rising. The price may struggle to go past these levels.
Support and Resistance Level Targets:
- Support Level Targets Points:
- Target 1: 2.91
- Target 2: 3.62
- Target 3: 2.91
- Resistance Level Targets Points:
- Target 1: 3.62
- Target 2: 2.91
- Target 3: 3.62
These "Target Points" could refer to the potential price movement for the stock based on support or resistance levels, showing expected price changes. For example, if the stock moves down from the current price, it may target a drop of around 2.91 points (for Target 1 under support), while a rise could lead to a target increase of 3.62 points (for Target 1 under resistance).
Technical Summary:
- The stock is currently trading near the pivot point of ₹143.29, indicating neutral sentiment.
- The support levels suggest that if the stock drops below ₹143.29, the next key support is at ₹140.37 (S1) and then ₹136.76 (S2).
- The resistance levels indicate that if the stock rises, it may face resistance at ₹146.90 (R1) and then ₹149.82 (R2).
These levels can help traders identify entry and exit points for their trades. If NHPC's price rises above resistance levels, it could signal a bullish trend, whereas a drop below support could indicate a bearish trend.
By using this information, traders can make informed decisions about where to place their buy or sell orders based on the expected market movement.
Leave a comment
Your email address will not be published. Required fields are marked *


