Analyzing key support and resistance levels, including target points for potential price movements in the Mid-Cap Nifty Index on December 10, 2024.
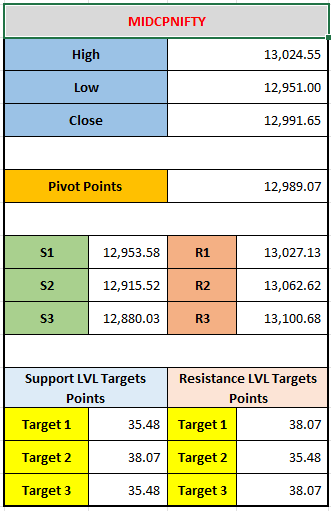
The technical analysis of an index or stock, specifically the MIDCPNIFTY (Mid-Cap Nifty Index). This data provides important levels for trading, such as the High, Low, Close, and Pivot Points, as well as the support and resistance levels.
Let's break down the key elements:
1. High, Low, Close:
- High (13,024.55): The highest point the MIDCPNIFTY index reached during the trading session.
- Low (12,951.00): The lowest point the index reached during the same period.
- Close (12,991.65): The closing value of the index at the end of the trading session.
2. Pivot Point (12,989.07):
- The Pivot Point is a key level that traders use to determine potential support and resistance levels. It acts as the midpoint for the current price range and can be used to gauge market sentiment. If the price is above the pivot point, it is considered bullish, and if below, it is considered bearish.
3. Support and Resistance Levels:
These levels are important for determining where the price might reverse direction (support) or face difficulty going higher (resistance).
Support Levels:
- S1 (12,953.58): The first level of support. If the price drops below this level, it might indicate further declines.
- S2 (12,915.52): A deeper level of support. If the index falls here, it could indicate a stronger downtrend.
- S3 (12,880.03): The third and deepest support level, usually seen as a strong price floor.
Resistance Levels:
- R1 (13,027.13): The first resistance level. If the price moves higher than this, it could face selling pressure and might reverse.
- R2 (13,062.62): A higher resistance level. This could indicate a stronger selling pressure area.
- R3 (13,100.68): The third resistance level. This is a strong barrier where price might face significant selling activity.
4. Support and Resistance Target Points:
- Support Level Target Points: These are the potential gains for the support levels.
- Target 1 (35.48): If the price moves down towards the first support level (S1), it could decline by 35.48 points.
- Target 2 (38.07): The expected movement if it hits S2.
- Target 3 (35.48): The expected movement towards S3, repeating the first target value.
- Resistance Level Target Points: These represent possible gains for the resistance levels.
- Target 1 (38.07): If the price rises towards the first resistance level (R1), it could gain 38.07 points.
- Target 2 (35.48): The expected movement if it hits R2.
- Target 3 (38.07): Similar to Target 1, but for R3.
Summary of Analysis:
- The MIDCPNIFTY index closed at 12,991.65, just below its pivot point of 12,989.07, indicating a neutral to slightly bearish sentiment.
- The support levels (S1, S2, S3) suggest that if the index drops, there are key price floors at 12,953.58, 12,915.52, and 12,880.03.
- On the other hand, the resistance levels (R1, R2, R3) indicate possible price ceilings at 13,027.13, 13,062.62, and 13,100.68, where upward momentum might face resistance.
- The target points for both support and resistance give an idea of how far the price might move, with target points fluctuating between 35.48 and 38.07 points.
This analysis provides traders with useful levels to set potential entry and exit points based on price action and trends.
By using this information, traders can make informed decisions about where to place their buy or sell orders based on the expected market movement.
Leave a comment
Your email address will not be published. Required fields are marked *


