Market Update for December 9, 2024: Analyze the NASDAQ's key pivot point, support, and resistance levels to forecast potential price movements for the trading day.
1. High, Low, and Close Values
These refer to the price range of the NASDAQ index during a trading session:
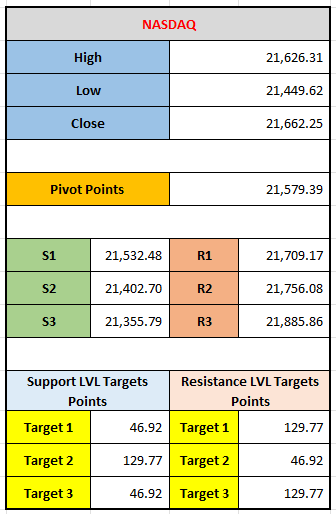
- High: 21,626.31 — This is the highest point reached during the last trading day.
- Low: 21,449.62 — This is the lowest point reached during the last trading day.
- Close: 21,662.25 — This is the final price at which the NASDAQ index was trading at the end of the last trading day.
2. Pivot Points
Pivot points are key levels that traders use to predict the potential support and resistance levels for the next trading day. The main pivot point is calculated based on the previous day's high, low, and close values:
- Pivot Point (PP): 21,579.39 — This is the central level of support and resistance. If the market is trading above this level, it indicates a bullish trend. If it's trading below, the trend is considered bearish.
3. Support and Resistance Levels
Support and resistance are psychological levels at which traders expect the price to either find support (where prices may bounce up) or face resistance (where prices may struggle to rise further).
- Support Levels (S1, S2, S3): These are price levels below the pivot point where the market may find buying interest (support).
- S1: 21,532.48 — The first support level, below the pivot point. If the price drops to this level, it could potentially bounce higher.
- S2: 21,402.70 — The second support level.
- S3: 21,355.79 — The third support level.
- Resistance Levels (R1, R2, R3): These are price levels above the pivot point where the market may face selling interest (resistance).
- R1: 21,709.17 — The first resistance level, above the pivot point. If the price rises to this level, it may face difficulty moving higher.
- R2: 21,756.08 — The second resistance level.
- R3: 21,885.86 — The third resistance level.
4. Target Points (Support/Resistance)
The target points listed (46.92 and 129.77) seem to refer to potential price movements or targets in terms of the distance from the pivot point or support/resistance levels. These numbers could represent how far the price is expected to move before encountering support or resistance. The targets could be seen as a way to estimate the distance to the next level of interest:
- Support Target 1 (46.92): This could be a target price level under the support range.
- Resistance Target 1 (129.77): Similarly, this is a potential price target for resistance.
- Target 2 and Target 3 show similar distances for the price to move before encountering support or resistance.
By using this information, traders can make informed decisions about where to place their buy or sell orders based on the expected market movement.
Leave a comment
Your email address will not be published. Required fields are marked *


