"Explore the key pivot points, support, and resistance levels for Jupiter Wagons on 12th December 2024. This analysis provides crucial price targets and market insights for traders."
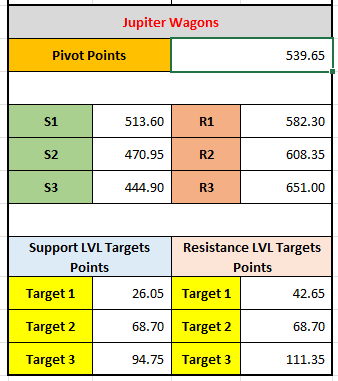
This based on pivot point analysis, which is a technical indicator used by traders to predict potential support and resistance levels for a stock or asset. These levels help traders make decisions about entry and exit points for trades. Here's how you can interpret this data for Jupiter Wagons for 12-12-2024:
Pivot Point
- The pivot point (539.65) is the baseline level, often considered the equilibrium point. If the price of the stock is above the pivot point, it's generally seen as bullish (upward momentum), while a price below the pivot point is considered bearish (downward momentum).
Support Levels (S1, S2, S3)
- Support levels represent points where the price may find buying interest, which could prevent it from falling further. They act as "floors" for the price:
- S1 (513.60): This is the first support level. If the price drops below the pivot point (539.65), it may find support at this level. If the price reaches or falls below 513.60, it could indicate further downward movement.
- S2 (470.95): This is a deeper support level. If the price falls through S1, it may look for support at 470.95.
- S3 (444.90): This is the most extreme support level. If the price continues to decline, it may hit this level.
Resistance Levels (R1, R2, R3)
- Resistance levels are points where the price may face selling pressure, making it harder for the price to rise further. They act as "ceilings" for the price:
- R1 (582.30): This is the first resistance level. If the stock price rises above the pivot point, it could face resistance around this level. If the price approaches or breaks 582.30, it might struggle to go higher without a correction.
- R2 (608.35): A higher resistance level. If the price breaks through R1, R2 would be the next potential barrier.
- R3 (651.00): The highest resistance level. If the price continues to rise beyond R2, it may face significant resistance around this level.
Support and Resistance Target Levels
These are targets for the stock's price movement based on the support and resistance levels.
- Support Target Levels:
- Target 1 (26.05): If the price falls to S1 (513.60), it could move toward a target at 26.05 points below that level.
- Target 2 (68.70): This is a further drop from the S1 level, moving toward 68.70 points lower.
- Target 3 (94.75): A deeper support level projection, further downward movement.
- Resistance Target Levels:
- Target 1 (42.65): If the price rises above R1 (582.30), the first resistance target is 42.65 points higher.
- Target 2 (68.70): A further upward movement from R1, aiming for 68.70 points higher.
- Target 3 (111.35): If the price continues upward, the third target would be 111.35 points higher from the R1 level.
Interpretation for Tomorrow
- If the stock price opens above 539.65, it could try to push towards R1 (582.30) and possibly even R2 (608.35) or R3 (651.00), depending on buying momentum.
- If the price opens below 539.65, it will first look for support at S1 (513.60). If it drops further, S2 (470.95) and S3 (444.90) are next.
- The support and resistance targets give more precise ranges for potential price movements in the upcoming trading day. For example, if it moves towards support, Target 1 might be in play, while moving towards resistance could take the price to Target 1 or higher.
If the market sentiment is bullish (e.g., positive news or market conditions), the price is more likely to head toward the resistance levels. If it is bearish (e.g., negative market sentiment or economic factors), the stock might head toward support levels. Keep in mind that these levels are not definitive but rather act as likely points where price action may change direction.
By using this information, traders can make informed decisions about where to place their buy or sell orders based on the expected market movement.
Leave a comment
Your email address will not be published. Required fields are marked *


