Future & Options - Foundational Trading Strategy. This statistics fully support and resistance, Trend line, Candle sticks patterns. These and all changing your trading journey.
Foundational Trading Strategy
Welcome to journeyoftrading. I’m using only candlestick patterns, support and resistance, trend lines, and pivot points. These indicators are enough for a trading strategy. This strategy includes proper entry and exit and stoploss with trading psychology.
For Frequent updates and more informations follow my page.
Live chart analysis video uploaded for below youtube link
https://youtube.com/@journeyoftrading2024?si=-7rHkIf3g1U8ZWS7
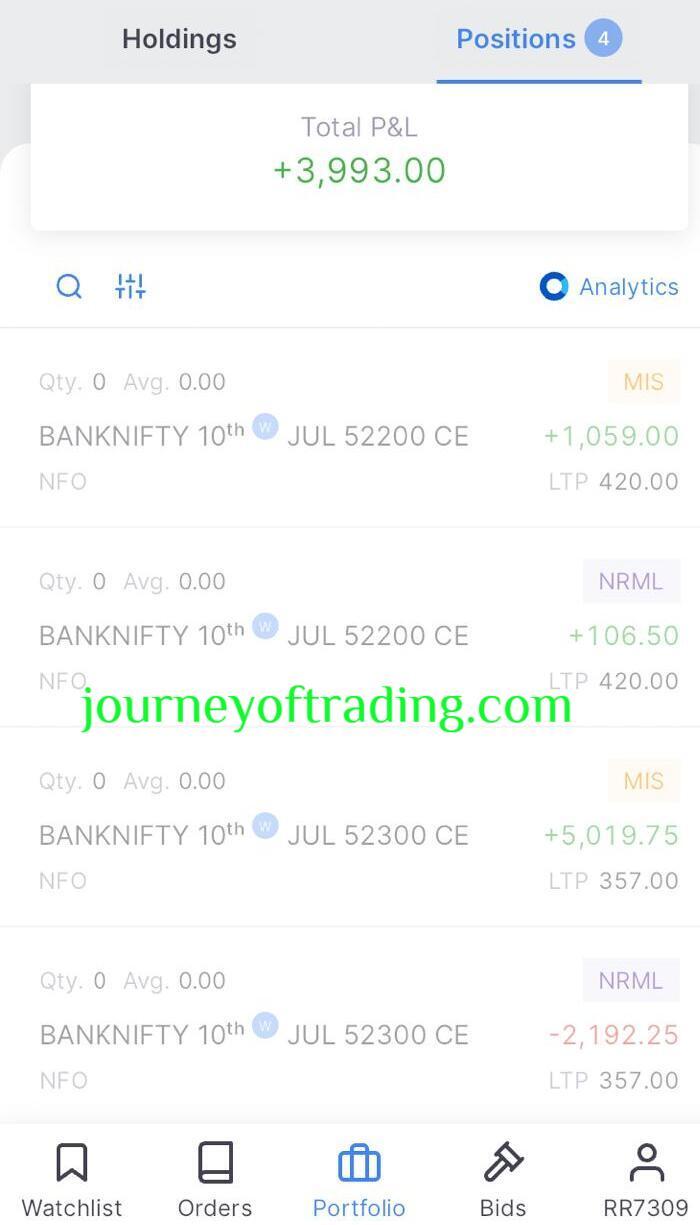
Today we have to discuss the Bank Nifty chart for July 8, 2024. Today, the market is open on a gap down. First the start candle, bearish hanging man. The next candle, the same opposite, was longer bullish. Some traders to be find out market going to up. The reason is a bullish candle. But the market reaction is totally opposite. The first two hours are fully volatile. Volatility means the market is going both ways. This time you take the entry call option or put the option, definitely your stop loss will be hit.
If you find the market volatile, don’t take the entry. Why? Because in the first trade, you make the loss. And your mind also thinks about how to recover from your loss. Please avoid the entry without confirmation. Toady also same like that happened. After 2 hours, I got three types of entry points. I will explain them one by one below.
Types Entry Points
1. Bearish Engulfing (PE)
2. Hammer (CE)
3. Hammer with today candle support (CE)
1.Bearish Engulfing
Today first candle hanging man. This open on yesterday below the 50%. And first candle take the support from yesterday support zone. This is one confirmation and second one is bullish candle. Definitely all trader mind set, market will going to up. But above one strong resistance zone already formed. Resistance zone marked for below the chart.

The first R1 (Resistance 1) yesterday reached a high point. This resistance zone was formed first, as you identified. On June 27, 2024, this zone reacted to support, and the same day again, it took the second support. But the next day, June 28, 2024, this zone reacted to resistance. The same condition happened today as well.
Yesterday's opening and high rejection were in the same zone. Today, it is also in the same resistance zone, R2 (Resistance 2). Sellers push the market toward a downward trend. The market takes support from a longer bullish candle with trend line. The candle touched the resistance zone repeatedly. Finally, sellers take control of market trends. A bearish candle formed. The market is going to go down. Market reached yesterday low point & take a support. The next entry will explain the below.
2.Hammer
As already mentioned in the previous post, the hammer is the most important candle. Now this hammer has been formed with S2 (Support 2). Here are two confirmations I got for the call option entry. One is a hammer candle, and another is a S2 support. The market is going to be up. Now buyers are taking control.
S2 entry hammer candle This is not a confirmation candle. It required a third conformation. That is also what I got. I will explain below.
· S1 Support
· S2 Entry for the call option
· Hammer candle close price less than next candle.
This entry doubles as confirmation for your reference below chart attached.

3.Hammer with today candle support
The next entry also has one hammer call option entry. What do you mean by today's candle support?
The first candle to react with support or resistance is called today candle support. The above-mentioned chart shows the shows the second support taken from the hammer candle top. Now you put a stop loss below the hammer candle bottom. It won't hit your stop loss. Risk-reward ratio import of your capital
Here, many fake candle formations happen. Don’t react to all the candles. Example: A morning star candle formed after the next candle down the direction. Market down to again reach the first candle support. Here, a morning star and bearish candle are also important candles. But the market reaction is the opposite.
Candles are not only a buying confirmation. Support, resistance, and trend line methods are also important. Support and resistance will play major roles for F&O. Candlesticks, support and resistance, and trendlines are things you must learn.
For Frequent updates and more informations follow my page.
Live chart analysis video uploaded for below youtube link
https://youtube.com/@ranjith142.?si=dz6UiNfzjNZNalz5

Leave a comment
Your email address will not be published. Required fields are marked *


