This analysis shows the potential support and resistance levels, giving traders an idea of where the index might move next. The support and resistance targets in points help determine the expected price action, guiding traders in making buy or sell decisions based on these levels.
The FINNIFTY, which refers to the Nifty Financial Services Index, a stock market index composed of 20 major financial services companies in India. These companies span banking, insurance, asset management, and other financial services. Let’s break down the various data points.
Key Data:
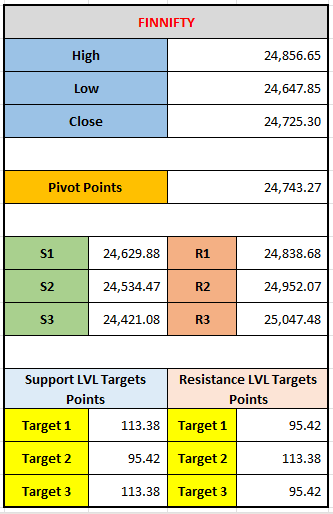
- High (24,856.65): This is the highest value reached by FINNIFTY during the given trading period.
- Low (24,647.85): This is the lowest value reached by FINNIFTY during the given trading period.
- Close (24,725.30): This is the closing value of FINNIFTY at the end of the trading session.
- Pivot Points (24,743.27): This is the central level calculated from the high, low, and close prices. It serves as a reference point for determining support and resistance levels. In this case, 24,743.27 is the pivot point, often considered a key level. If the price stays above this level, it could indicate a bullish market sentiment; if it drops below, it may indicate a bearish trend.
Support and Resistance Levels:
- Support Levels (S1, S2, S3): These are price levels where the index is expected to find buying interest or support, preventing it from falling further.
- S1 (24,629.88): The first level of support.
- S2 (24,534.47): The second level of support.
- S3 (24,421.08): The third level of support.
- Resistance Levels (R1, R2, R3): These are price levels where the index is expected to encounter selling pressure, preventing it from rising further.
- R1 (24,838.68): The first level of resistance.
- R2 (24,952.07): The second level of resistance.
- R3 (25,047.48): The third level of resistance.
Target Points:
- The Support Level Target Points and Resistance Level Target Points represent the potential movement (in points) towards these levels from the closing price:
- Support Targets (113.38 points, 95.42 points, 113.38 points): These indicate potential downward movements towards each support level.
- Resistance Targets (95.42 points, 113.38 points, 95.42 points): These indicate potential upward movements towards each resistance level.
Interpretation:
- If FINNIFTY's price approaches or breaks through any of the resistance levels (R1, R2, or R3), it might continue moving upward.
- If the price falls toward or breaks below any of the support levels (S1, S2, or S3), it may continue moving downward.
- Pivot points act as psychological levels that traders watch to assess the trend's direction. If the price is above the pivot point, the market is generally considered bullish, while if it is below, it’s seen as bearish.
By using this information, traders can make informed decisions about where to place their buy or sell orders based on the expected market movement.
Leave a comment
Your email address will not be published. Required fields are marked *


