This technical review examines key support and resistance levels, along with pivot points, to forecast potential price movements for MapmyIndia stock.
The technical analysis for CE Info Systems (commonly known as MapmyIndia), a company that provides digital mapping, location-based services, and geographic information systems (GIS).
Here’s a breakdown of the key technical analysis details provided for the stock:
Stock Price Details:
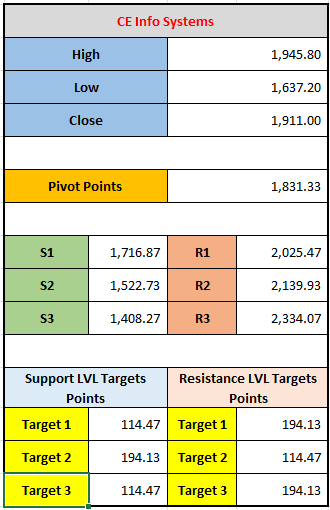
- High: 1,945.80 — This is the highest price at which the stock traded during the session.
- Low: 1,637.20 — This is the lowest price at which the stock traded during the session.
- Close: 1,911.00 — This is the price at which the stock closed at the end of the trading session.
Pivot Points:
Pivot points are technical indicators used to determine potential support and resistance levels for the stock.
- Pivot Point: 1,831.33 — The pivot point is a key level that traders often use as a reference point for determining support and resistance. The stock’s price above or below this level could signal a bullish or bearish trend.
Support Levels (S1, S2, S3):
Support levels are points where the price tends to stop falling and may reverse direction. These are seen as price levels that are below the current price.
- S1 (1,716.87): The first support level, which is considered a level where the stock could find some buying interest if it starts to decline.
- S2 (1,522.73): The second support level, which is a more significant level of support, typically where the stock may face increased buying activity.
- S3 (1,408.27): The third support level, which represents a deeper support zone where the stock could face a stronger level of buying.
Resistance Levels (R1, R2, R3):
Resistance levels are points where the stock faces selling pressure and tends to stop rising. These are seen as price levels above the current price.
- R1 (2,025.47): The first resistance level, where selling may occur if the stock rises further.
- R2 (2,139.93): The second resistance level, a stronger point where the stock could face resistance.
- R3 (2,334.07): The third resistance level, a more significant resistance zone.
Support and Resistance Target Points:
The targets here show the possible expected movement based on the support and resistance levels:
- Support Level Target 1: 114.47
- Support Level Target 2: 194.13
- Support Level Target 3: 114.47
- Resistance Level Target 1: 194.13
- Resistance Level Target 2: 114.47
- Resistance Level Target 3: 194.13
These targets may suggest the potential price movement range for the stock over the short term. The numbers seem to suggest a focus on price movement between support and resistance levels, with targets possibly showing expected changes in volatility or price action.
Interpretation:
- Current Price Action: With the stock closing at 1,911.00, it is near the pivot point (1,831.33), which may suggest the stock is in a neutral zone. Traders might expect the stock to rise if it breaks above the resistance levels or decline if it falls below support.
- Short-Term Outlook: The stock may experience volatility between the support and resistance levels mentioned. A breakout above R1 (2,025.47) would signal a potential bullish trend, while a drop below S1 (1,716.87) could indicate a bearish trend.
By using this information, traders can make informed decisions about where to place their buy or sell orders based on the expected market movement.
Leave a comment
Your email address will not be published. Required fields are marked *


