Bank Nifty data and explain the Pivot Points, Support Levels, Resistance Levels, and Support and Resistance Target Points.
1. High, Low, Close
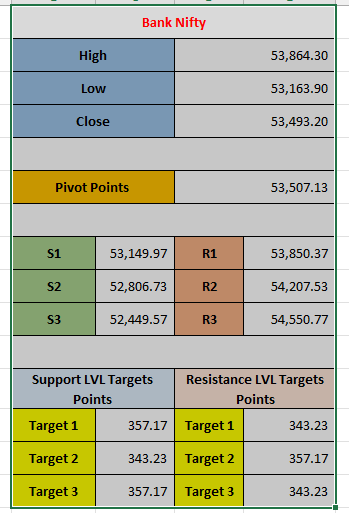
- High (53,864.30): The highest price Bank Nifty reached during the trading session of Yesterday.
- Low (53,163.90): The lowest price Bank Nifty reached during the trading session of Yesterday.
- Close (53,493.20): The closing price of Bank Nifty at the end of the session of Yesterday.
2. Pivot Point
- Pivot Point (53,507.13): The pivot point is the average of the high, low, and close prices for the session, and it serves as the baseline for determining potential support and resistance levels for the next session.
- The pivot point (53,507.13) is a critical level. If the price is above it, there may be upward momentum (bullish), and if below, there may be downward momentum (bearish).
3. Support and Resistance Levels
- Support Levels (S1, S2, S3) represent price points where the market might find buying interest, which could potentially stop or reverse a downward price movement.
- S1 (53,149.97): The first support level. If the price falls below the pivot point (53,507.13), this is the first level where the price might find support.
- S2 (52,806.73): The second support level. If the price falls further, this is the next level where the market might find support.
- S3 (52,449.57): The third support level. If the price continues downward, this level would be a strong support area.
- Resistance Levels (R1, R2, R3) represent price points where the market might encounter selling pressure, preventing the price from rising further.
- R1 (53,850.37): The first resistance level. If the price rises above the pivot (53,507.13), this is the first potential resistance level where the market might face selling pressure.
- R2 (54,207.53): The second resistance level. If the price rises further, this level becomes the next resistance barrier.
- R3 (54,550.77): The third resistance level. This is a stronger resistance level where the market might encounter significant selling pressure if the price continues to rise.
4. Support and Resistance Target Points
The Support and Resistance Target Points are the price moves or distances that traders calculate based on the support and resistance levels. These targets give insight into how far the price might move in relation to these key levels.
- Support Level Targets (how far the market could move downward):
- Target 1 (357.17): This is the distance between the pivot point (53,507.13) and the first support level (S1 = 53,149.97). The distance is 357.17 points, which means the price may potentially drop by this amount from the pivot point to reach the first support level.
- Target 2 (343.23): This is the distance from the pivot point (53,507.13) to the second support level (S2 = 52,806.73), which is 343.23 points.
- Target 3 (357.17): This is again the same as Target 1, indicating a similar distance between the pivot and the third support level (S3 = 52,449.57), which is 357.17 points.
- Resistance Level Targets (how far the market could move upward):
- Target 1 (343.23): This is the distance from the pivot point (53,507.13) to the first resistance level (R1 = 53,850.37). The distance is 343.23 points, meaning the price could potentially rise by this amount from the pivot point to reach the first resistance level.
- Target 2 (357.17): The distance from the pivot (53,507.13) to the second resistance level (R2 = 54,207.53), which is 357.17 points.
- Target 3 (343.23): This is the same as Target 1, showing that the distance from the pivot to the third resistance level (R3 = 54,550.77) is 343.23 points.
Summary of Explanation:
- Pivot Point (53,507.13): This is the central level used to gauge the potential market direction. If the price is above it, the market may trend upward (bullish), and if below, the market may trend downward (bearish).
- Support Levels (S1, S2, S3): These are levels where the market could potentially find support and reverse an existing downtrend. S1 is the first level of support, with S2 and S3 being progressively deeper support levels.
- Resistance Levels (R1, R2, R3): These are levels where the market could face resistance, stopping an uptrend and potentially causing a downward reversal. R1 is the first level of resistance, with R2 and R3 being higher resistance levels.
- Target Points: These represent potential price moves, showing the distance from the pivot to the support and resistance levels. The targets help traders anticipate how far the price might move in relation to the key support and resistance levels, guiding buy or sell decisions.
By using this information, traders can make informed decisions about where to place their buy or sell orders based on the expected market movement.
Leave a comment
Your email address will not be published. Required fields are marked *


