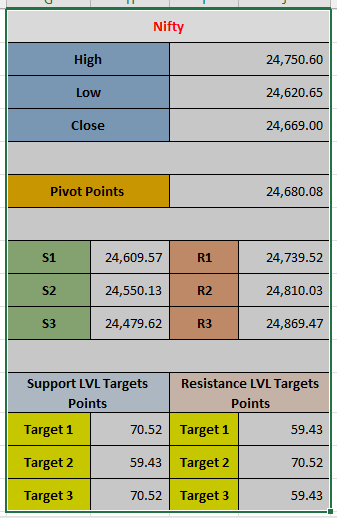
The pivot point is 24,680.08, indicating potential market movement. Support levels are at S1 (24,609.57), S2 (24,550.13), and S3 (24,479.62), while resistance levels are at R1 (24,739.52), R2 (24,810.03), and R3 (24,869.47). Target points for support and resistance levels reflect possible price movements based on these levels.
1. High, Low, and Close:
- High: 24,750.60 – This is the highest point the Nifty index reached during the trading session of yesterday.
- Low: 24,620.65 – This is the lowest point the Nifty index reached during the trading session of yesterday.
- Close: 24,669.00 – This is the final closing price of the Nifty index at the end of the trading session of yesterday.
2. Pivot Points:
Pivot points are widely used in technical analysis to determine potential levels of support and resistance. They help traders identify trends and make decisions about entry or exit points in the market. The Pivot Point itself is the average of the high, low, and close prices, which serves as a key level to observe.
- Pivot Point (PP): 24,680.08 – This is the primary reference level around which the market may pivot (move either up or down).
3. Support and Resistance Levels:
These are calculated levels that traders use to determine potential price reversal points or where the price might face obstacles. Support levels are seen as "floors" that the price might not fall below, while resistance levels are seen as "ceilings" that the price may not exceed.
- S1, S2, S3 (Support Levels):
- S1: 24,609.57
- S2: 24,550.13
- S3: 24,479.62
These are descending levels of support. If the Nifty index falls below the pivot point (24,680.08), these are the potential support levels where the price could find buying interest.
- R1, R2, R3 (Resistance Levels):
- R1: 24,739.52
- R2: 24,810.03
- R3: 24,869.47
These are ascending levels of resistance. If the Nifty index moves upward from the pivot point (24,680.08), these levels represent the points where the price could face selling pressure.
4. Support and Resistance Target Points:
These targets indicate the expected range of movement for support and resistance.
- Support LVL Targets Points:
- Target 1: 70.52
- Target 2: 59.43
- Target3:70.52
These targets represent the possible points the Nifty index might fall to, based on the support levels mentioned earlier.
- Resistance LVL Targets Points:
- Target 1: 59.43
- Target 2: 70.52
- Target3:59.43
These targets represent the possible points the Nifty index might reach based on the resistance levels mentioned earlier.
Summary:
- The Pivot Point (24,680.08) is the reference level.
- If the price goes below this pivot, it may find support at S1, S2, or S3 levels.
- If the price rises above the pivot, it may face resistance at R1, R2, or R3 levels.
- The target points (Support and Resistance LVL Targets) represent the magnitude of price movement expected from the support and resistance levels, respectively.
By using this information, traders can make informed decisions about where to place their buy or sell orders based on the expected market movement.
Leave a comment
Your email address will not be published. Required fields are marked *

