Get accurate Nifty 50 pivot levels for 05 May 2026 including support and resistance zones. Improve your intraday trading strategy with expert analysis from Journey of Trading.
NIFTY 50 Pivot Levels – 05 May 2026
At Journey of Trading, we provide precise and actionable pivot levels to help traders make informed intraday decisions in the NIFTY 50 index.
🔹 What Are Pivot Levels?
Pivot points are widely used technical indicators that help identify potential support and resistance zones. These levels are calculated using the previous trading session’s high, low, and close, giving traders a clear view of possible market direction.
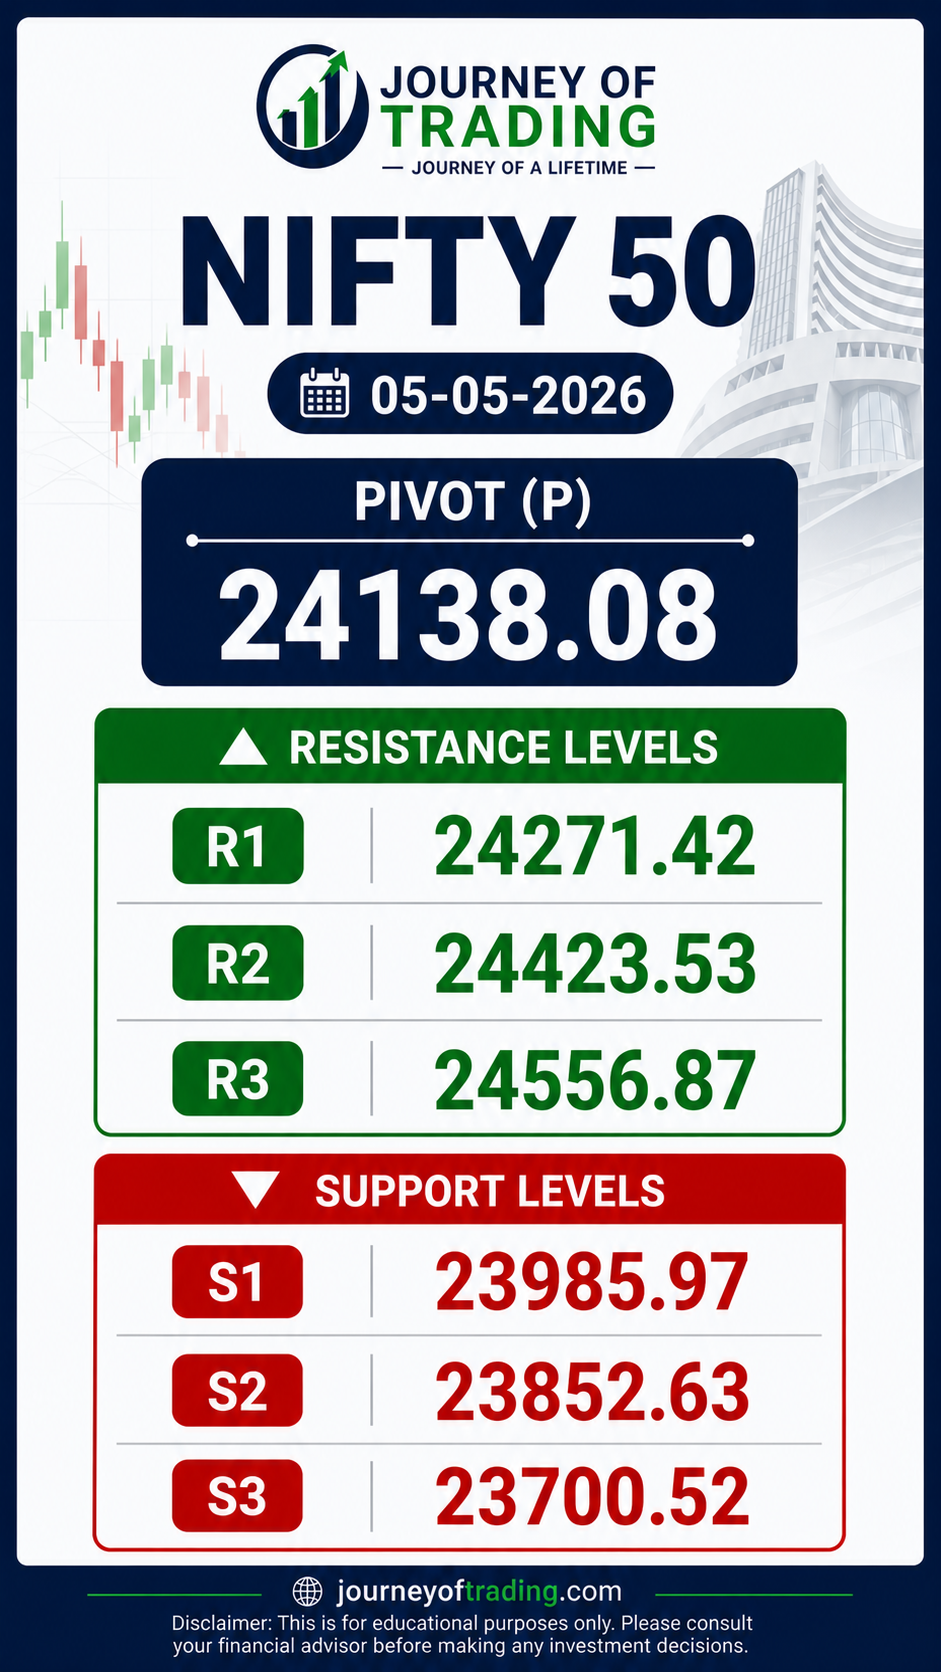
📊 Key Levels for NIFTY 50 (05-05-2026)
🔵 Pivot Point (P)
24138.08
The pivot point acts as the central price level:
Trading above pivot → bullish sentiment
Trading below pivot → bearish sentiment
🟢 Resistance Levels (Upside Targets)
R1: 24271.42
R2: 24423.53
R3: 24556.87
These levels indicate where the market may face selling pressure during upward movement.
🔴 Support Levels (Downside Zones)
S1: 23985.97
S2: 23852.63
S3: 23700.52
These levels act as buying zones where price may find support.
📈 How Traders Use These Levels
Breakout Strategy:
Enter trades when price breaks above resistance or below support with strong volume.
Reversal Strategy:
Watch for price rejection at R1/R2 or S1/S2 to take counter-trend trades.
Intraday Bias:
Use the pivot point to determine overall market direction for the day.
Note:-
By using this information, traders can make informed decisions about where to place their buy or sell orders based on the expected market movement.
Leave a comment
Your email address will not be published. Required fields are marked *