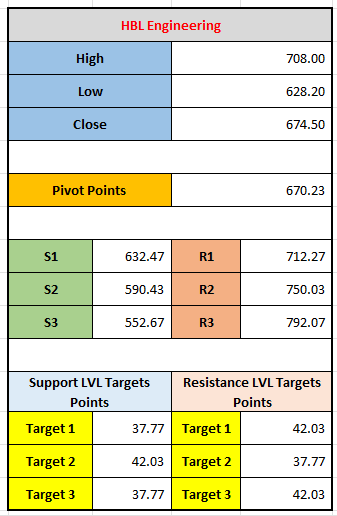
In this HBL Engineering stock forecast for December 9, 2024, we analyze key support, resistance, and pivot levels to guide potential price movements. The analysis helps investors identify critical entry and exit points based on technical indicators.
Here's a detailed explanation of the stock HBL Engineering and the various technical indicators and levels related to it:
1. Stock Information:
- High Price: 708.00
- Low Price: 628.20
- Close Price: 674.50
These prices represent the highest, lowest, and closing prices of HBL Engineering's stock within a certain time frame (likely for a yesterday).
2. Pivot Points:
- Pivot Point: 670.23
Pivot points are used in technical analysis to determine potential support and resistance levels based on the previous trading period’s high, low, and close prices. A pivot point of 670.23 is the primary level that traders use to assess the direction of price movement. If the stock price is above the pivot point, it is generally seen as a bullish signal; if it's below, it may signal a bearish trend.
3. Support and Resistance Levels:
Support and resistance levels are critical for identifying price points where the stock may reverse its trend (support) or encounter difficulty moving higher (resistance).
Support Levels (S1, S2, S3): These levels represent potential areas where the price might find support during a price drop.
- S1 (632.47): The first support level, where the stock may find some buying interest if the price falls.
- S2 (590.43): The second support level, deeper in the price range, offering stronger support.
- S3 (552.67): The third support level, indicating an even stronger support zone.
Resistance Levels (R1, R2, R3): These levels represent potential price points where the stock might face resistance or selling pressure.
- R1 (712.27): The first resistance level, where the stock may face difficulty rising further.
- R2 (750.03): The second resistance level, showing a higher price zone where the stock might again face selling pressure.
- R3 (792.07): The third resistance level, marking a strong resistance point at a higher price.
4. Support and Resistance Level Targets:
These targets are calculated to assess potential movement within support and resistance zones:
- Support LVL Targets:
- Target 1: 37.77
- Target 2: 42.03
- Target 3: 37.77
These targets represent the potential price movement or price targets that the stock may achieve if it moves downward from its current position. For example, the stock may test a decline towards these targets.
- Resistance LVL Targets:
- Target 1: 42.03
- Target 2: 37.77
- Target 3: 42.03
These targets reflect potential price levels to the upside if the stock breaks through its resistance levels. If the stock is rising, these targets are used to predict potential points where the price might face difficulty moving higher.
Summary:
- Current Trend: Based on the pivot point and the support and resistance levels, HBL Engineering appears to be in a neutral to bullish range if the stock stays above the pivot point of 670.23.
- Support and Resistance: The first support is at 632.47, and the first resistance is at 712.27. If the price breaks the pivot point, the next levels are 590.43 (support) and 750.03 (resistance).
- Target Levels: For traders looking for price movement targets, the stock could potentially aim for upward or downward moves toward the support and resistance levels provided.
By using this information, traders can make informed decisions about where to place their buy or sell orders based on the expected market movement.
Leave a comment
Your email address will not be published. Required fields are marked *

